
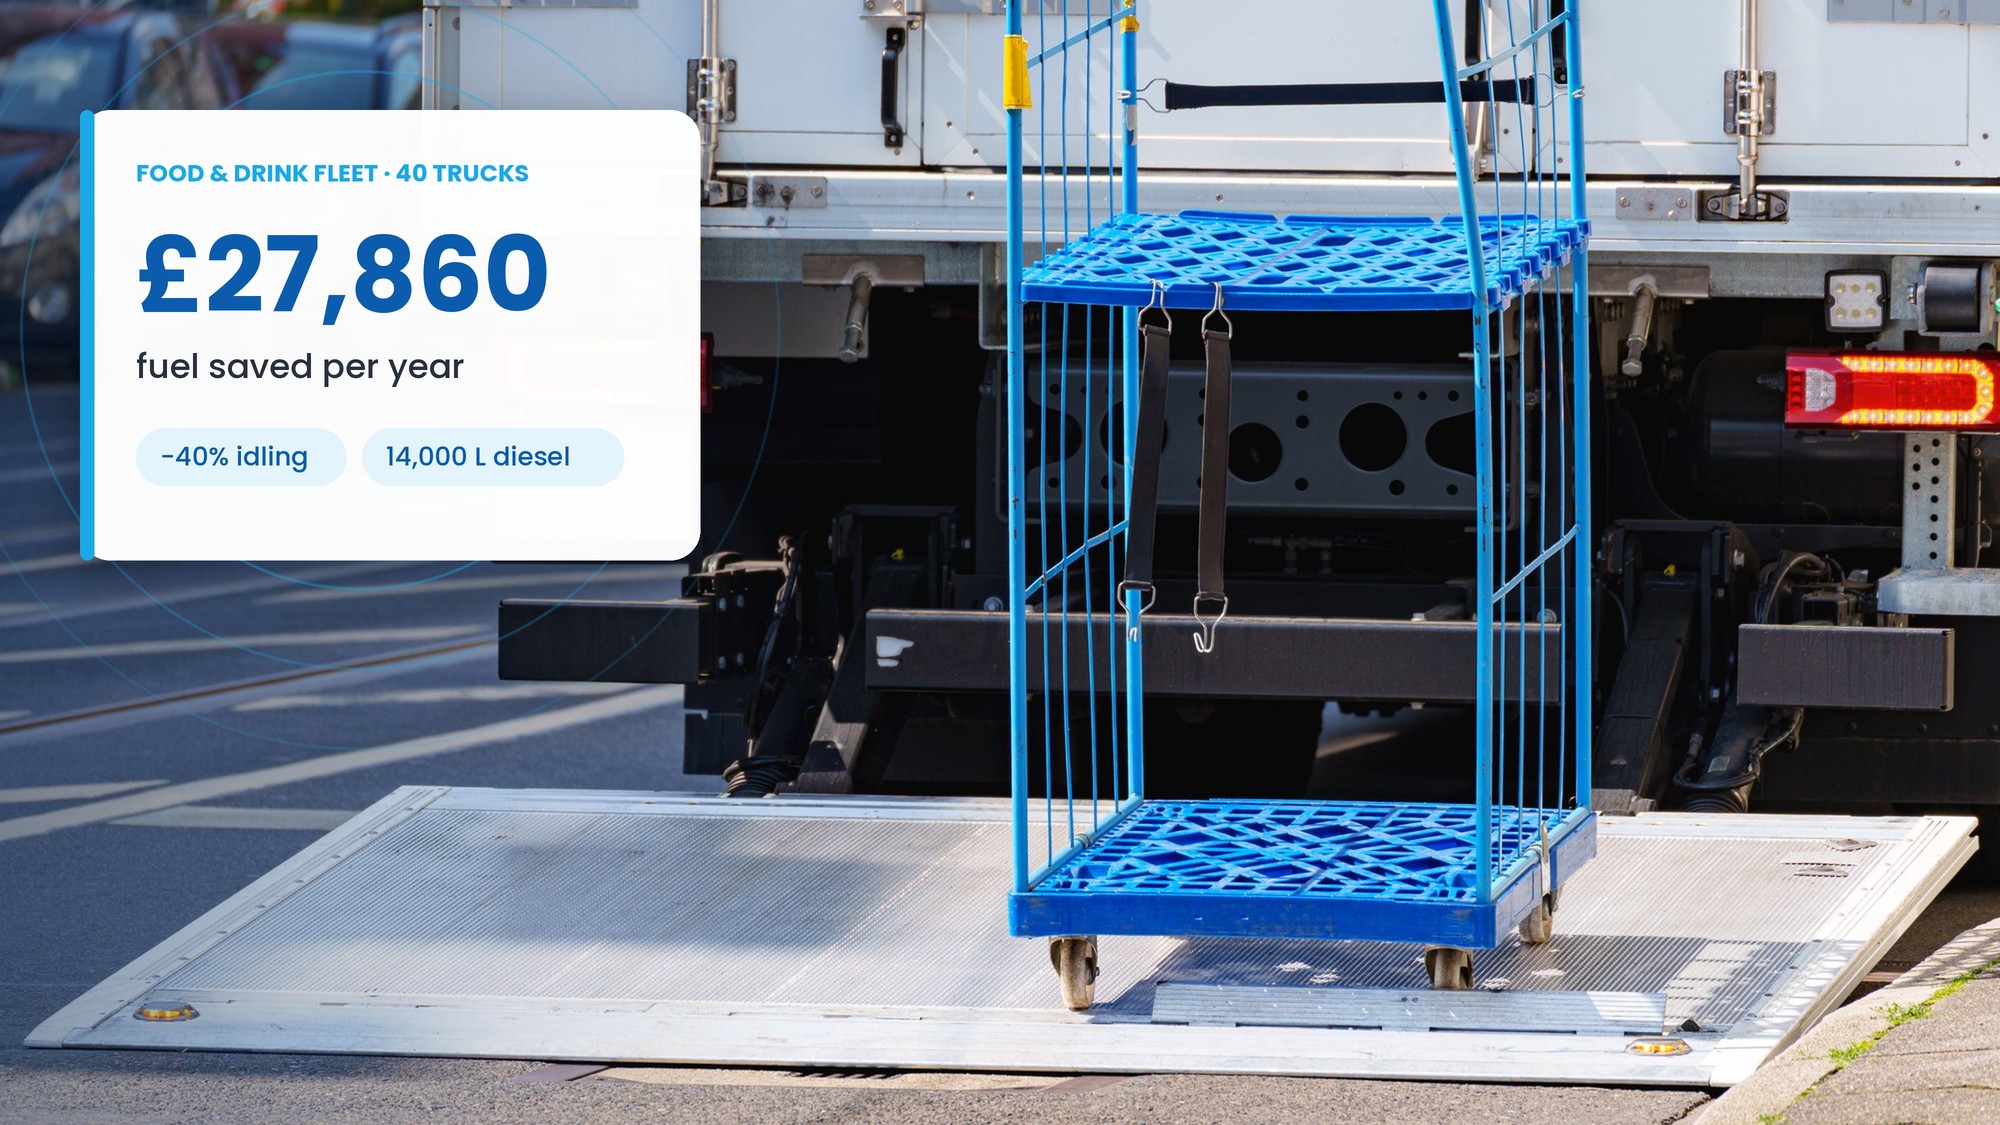
40 rigid HGVs
12–20 drops a day
Food & drink distribution
AC Cloud
Example scenario: this use case shows how a typical fleet could use AC Cloud. The company and figures are illustrative.
The challenge
A regional food and drink distributor runs 40 rigid HGVs on multi-drop routes to pubs, restaurants and convenience stores. Each vehicle makes 12 to 20 drops a day.
Fuel is the business’s second-largest cost after wages, and it rose sharply as diesel approached £2 a litre in 2026. The transport manager suspected idling was part of the problem but had no data to prove it.
Common situations on these routes:
The approach with AC Cloud
Six steps over the first two months, using features the fleet already has in AC Cloud.
Step 1
WEEK 1-2
The distributor uses AC Cloud idle reports to record driving time, idle time and idle rate for every vehicle. The data shows an average of 1 hour and 10 minutes of idling per vehicle per day and an idle rate of around 19%.
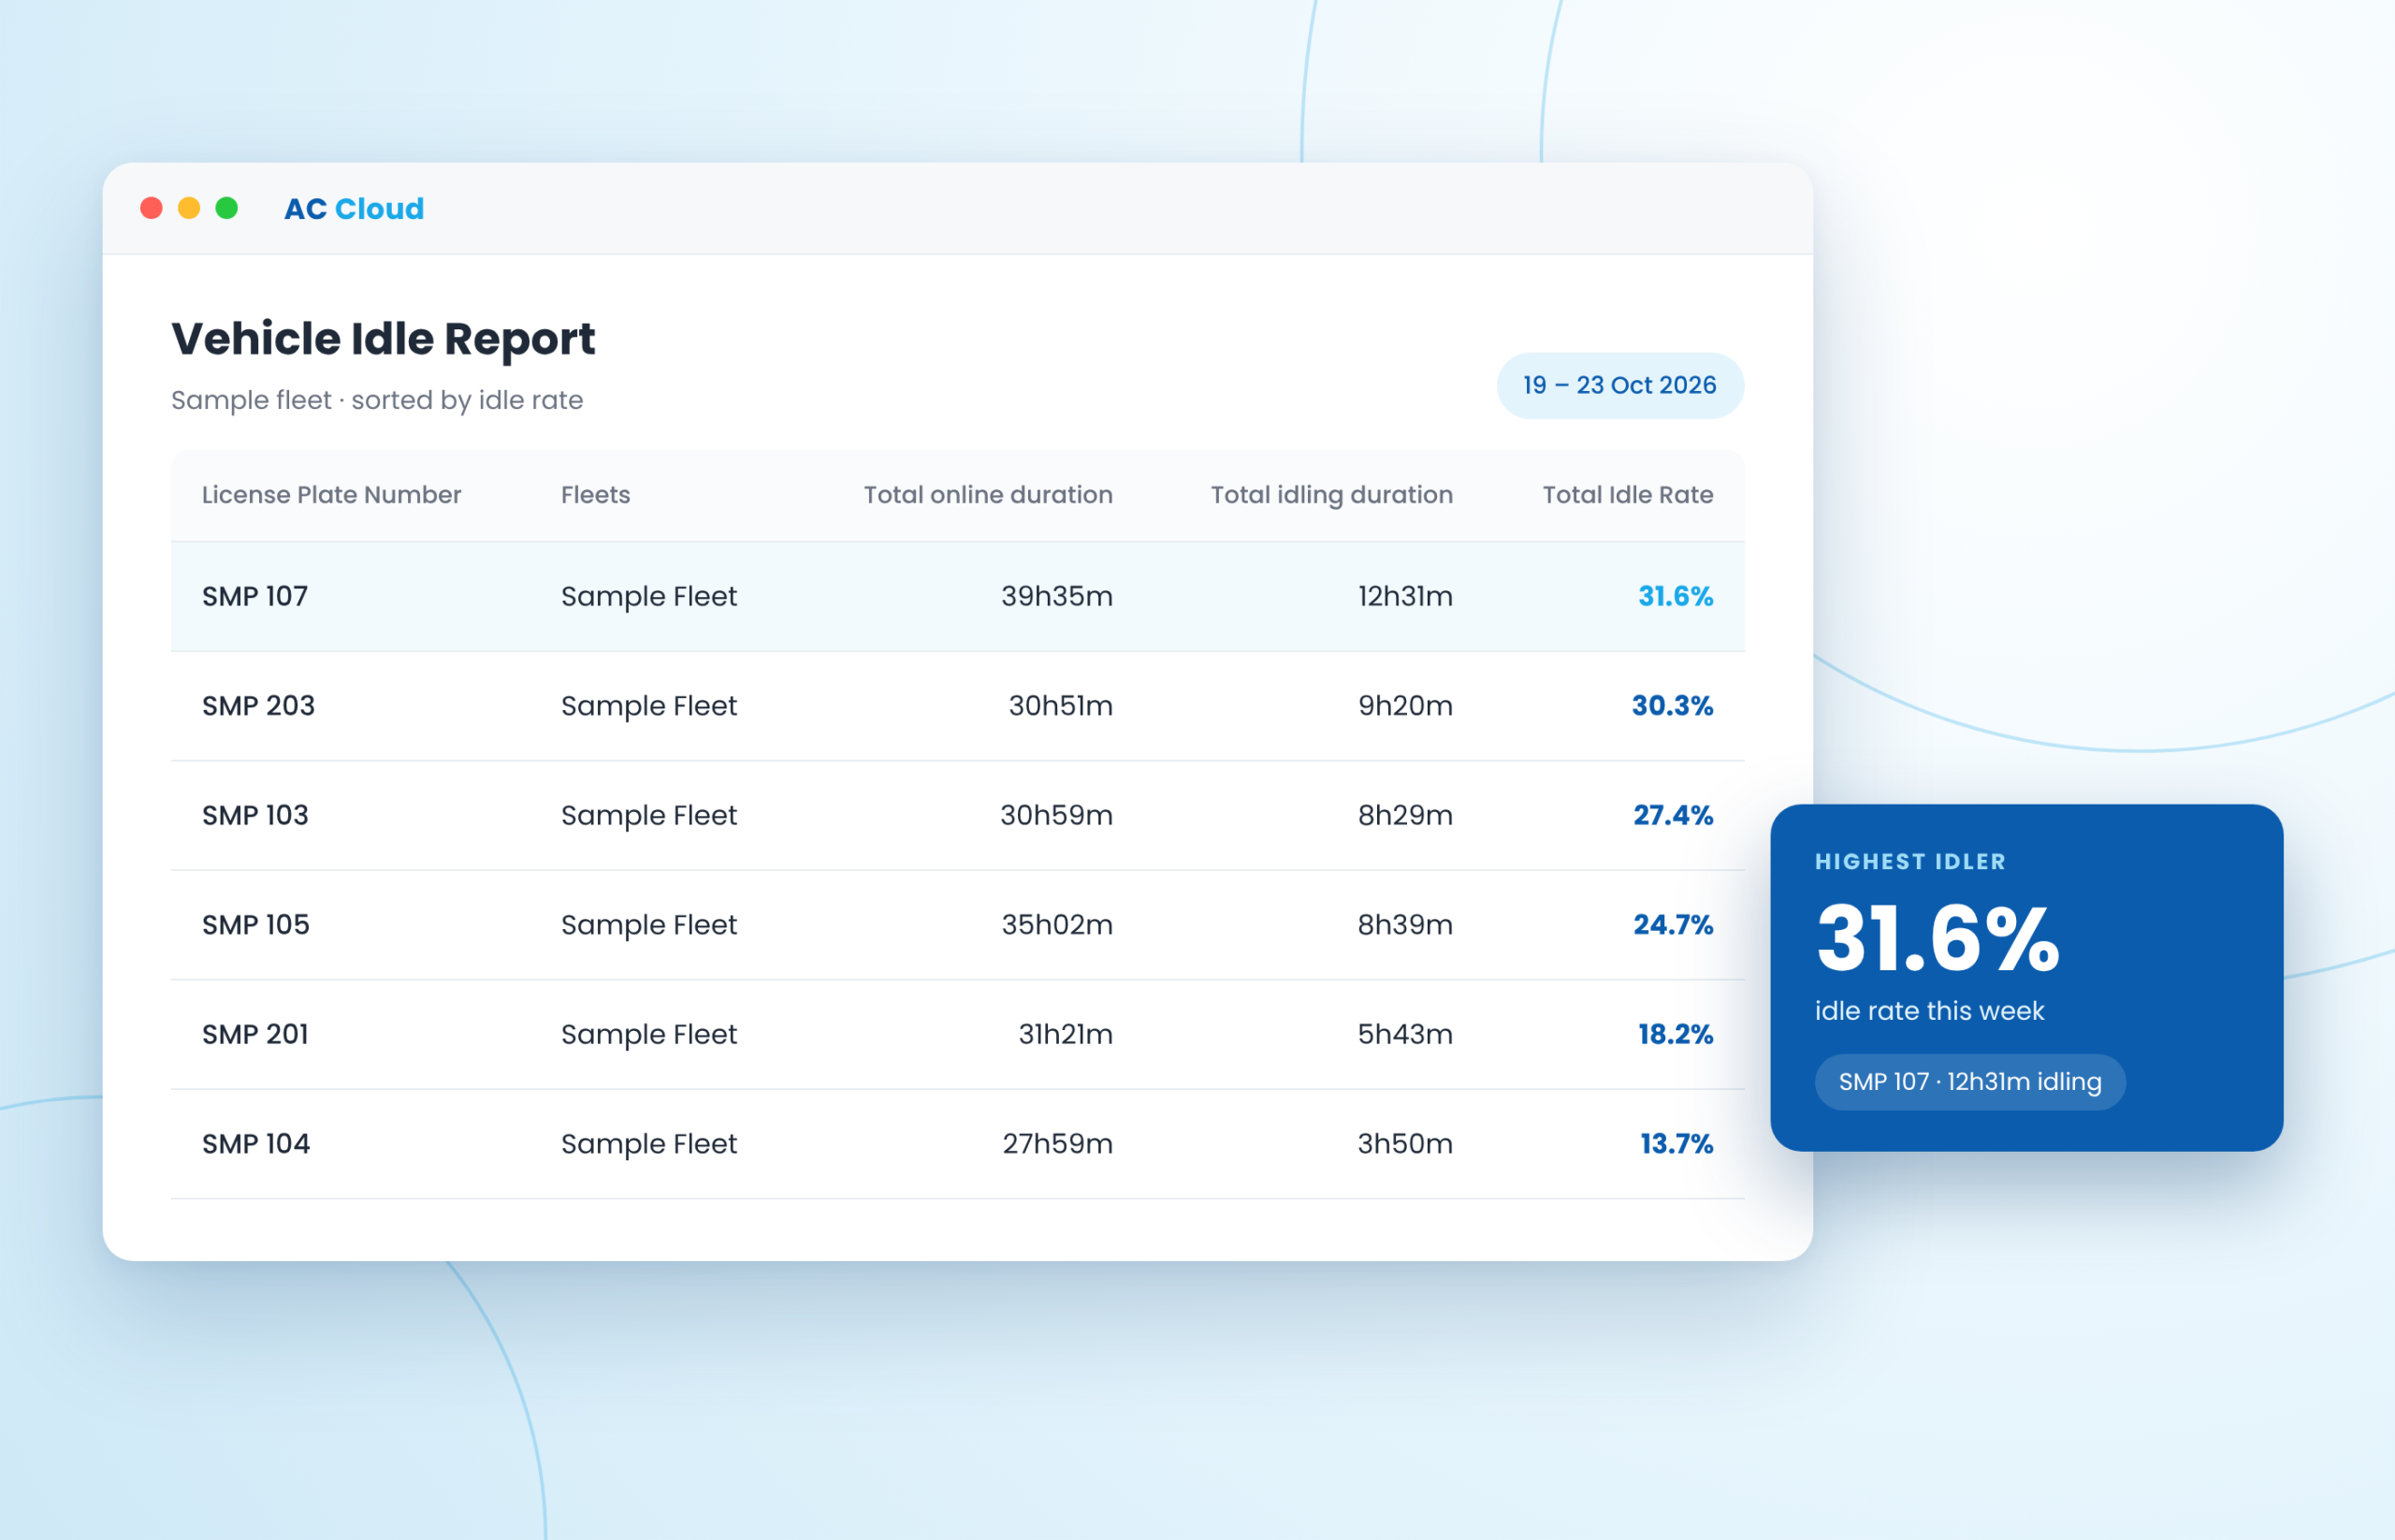
Step 1: measure idle rate for every vehicle.
Step 2
WEEK 2-3
Find the patterns
Using trip history and parking duration on the map, the team finds that most idling happens in three places:
- Early-morning loading queues at the depot
- Two large customer sites with long waits for delivery slots
- Driver breaks between 11am and 2pm
Step 3
WEEK 4
Set a policy and real-time alerts
The company introduces a simple rule: switch off if stopped for more than 2 minutes, except in traffic. In AC Cloud, it sets a 5-minute idle alert. When a vehicle exceeds the limit, the transport office gets a push notification and can contact the driver.
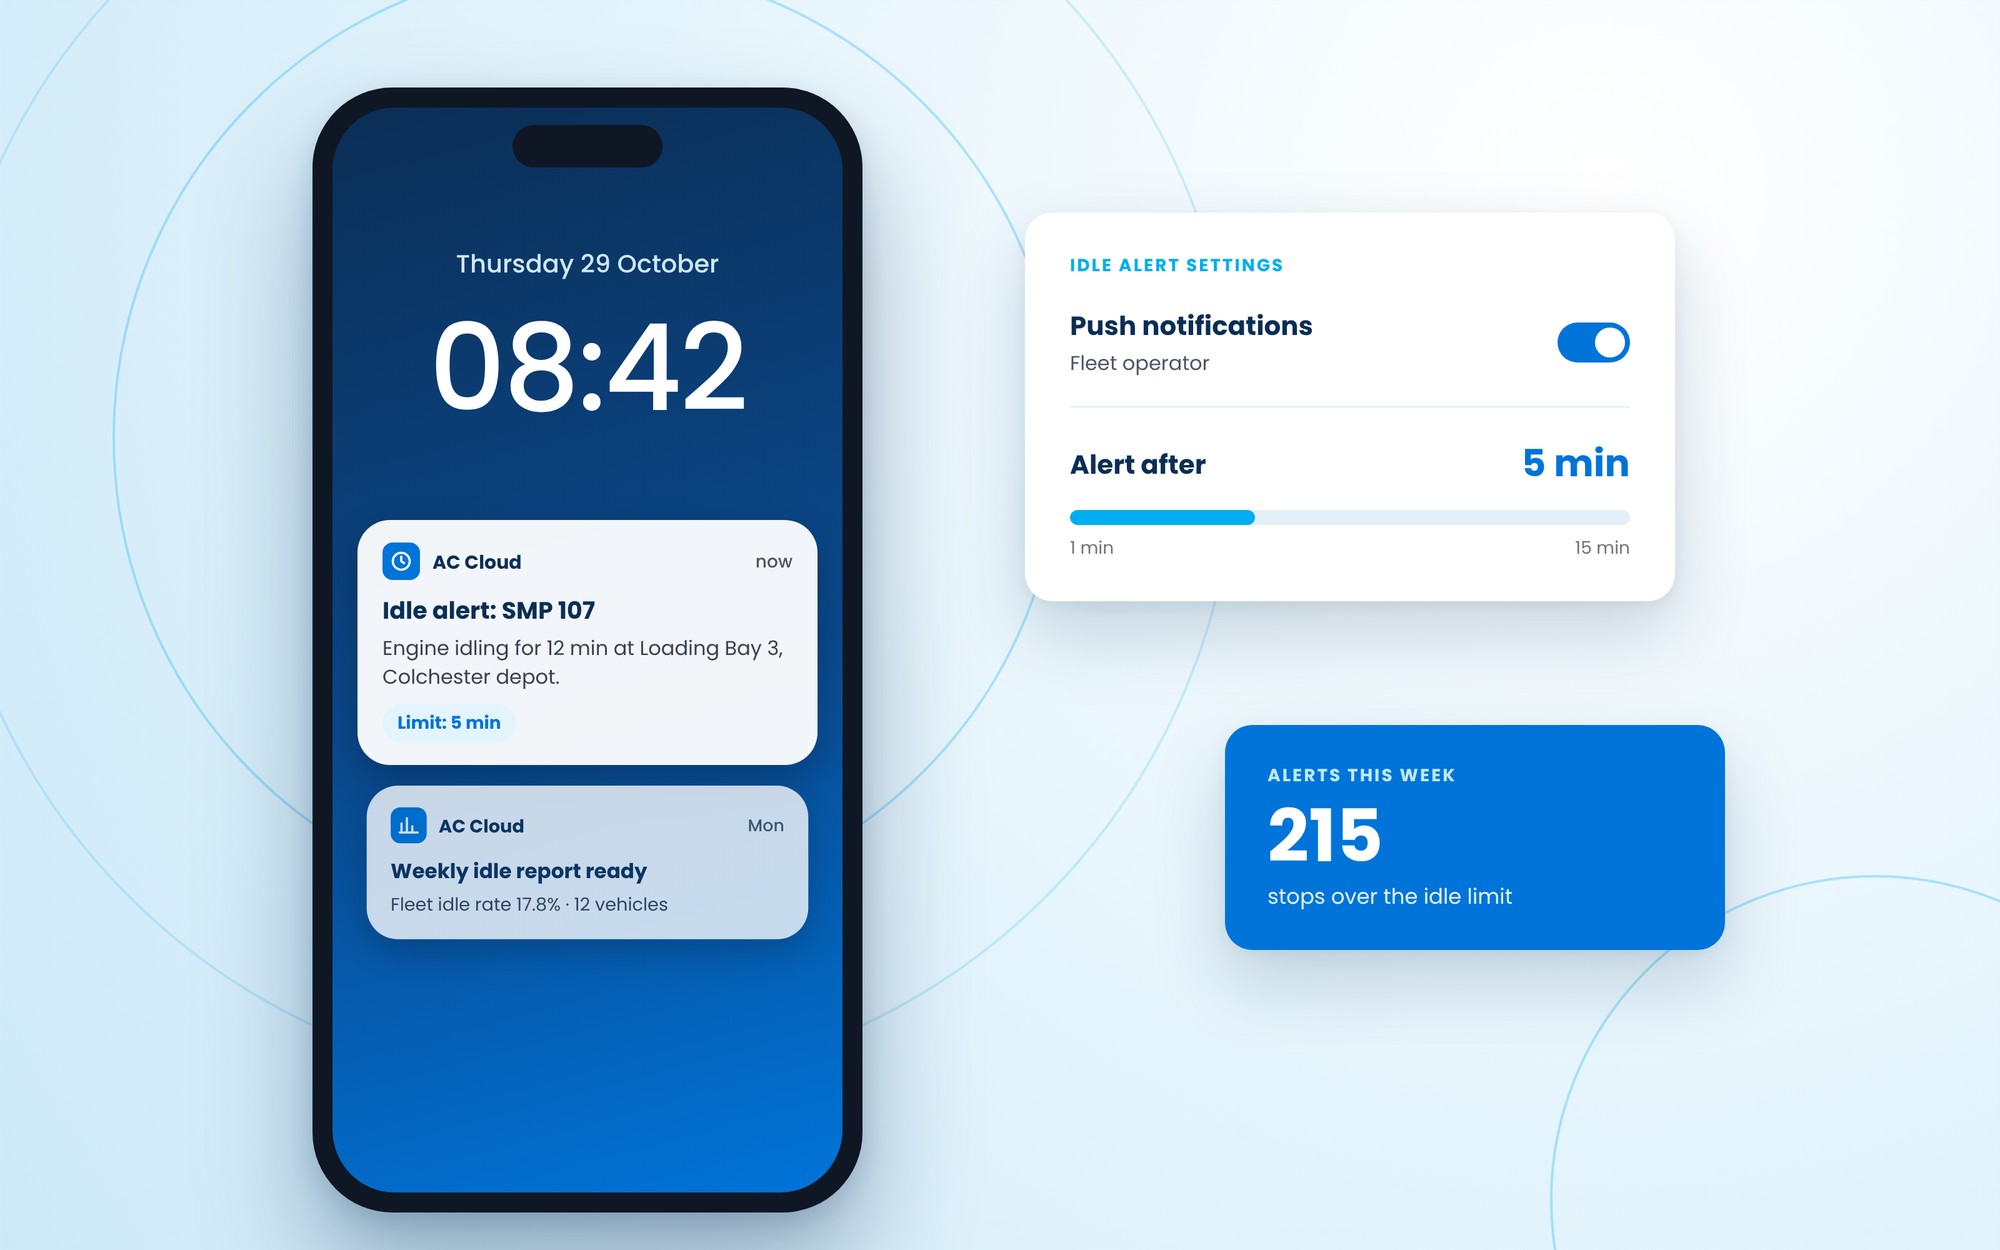
Step 3: get alerted when a vehicle idles past your limit.
Step 4
WEEK 4 ONWARDS
Share the data with drivers
A weekly idle report is scheduled to arrive every Monday morning. Depot managers share idle rates with drivers, recognise the most improved and coach those with the highest rates.
Step 5
MONTH 2Fix the site problems
Fix the site problems
Idle data from the two problem customer sites supports a conversation about delivery slot times. The depot staggers loading start times to shorten morning queues.
Step 6
ONGOING
With OBD data, idle time is shown alongside fuel use and mileage, so the business can report fuel and carbon savings each month. Fleets with ACSS AI driver cameras can also use video playback to understand the context of idle events.
The potential results
Cutting idle time by 40%, from 70 minutes to around 42 minutes a day per vehicle, could deliver:
| Measure | Before | After (40% less idling) | Saving per year |
|---|---|---|---|
| Idle time per vehicle per day | 70 min | 42 min | 28 min/day |
| Fuel burned idling (40 HGVs) | ~35,000 L | ~21,000 L | ~14,000 L |
| Fuel cost (at £1.99/L) | ~£69,650 | ~£41,790 | ~£27,860 |
| CO2e from idling | ~90 tonnes | ~54 tonnes | ~36 tonnes |
Assumes 3 litres of diesel per idle hour, 250 working days and 2.57 kg CO2e per litre.